For automotive technicians, navigating the complexities of driveability diagnostics can often feel like deciphering a cryptic code. When facing perplexing engine issues, a systematic approach is crucial, and one of the most effective starting points is leveraging the power of an OBD2 scan tool. While factory scan tools offer comprehensive capabilities, generic OBD2 scan tools present a cost-effective and remarkably versatile alternative, capable of addressing a significant majority of driveability concerns.
In fact, a substantial portion of driveability problems – around 80% – can be effectively diagnosed or significantly narrowed down using the generic parameters available through an OBD2 scan tool, often obtainable for under $300. Furthermore, recent advancements and updates to OBD2 standards have dramatically increased the volume and depth of data accessible via these tools, making them even more indispensable for modern automotive diagnostics.
Initially, OBD2 specifications offered up to 36 parameters, with vehicles typically supporting between 13 and 20. However, revisions spearheaded by the California Air Resources Board (CARB) for CAN-equipped OBD2 vehicles have expanded the potential generic parameter list to over 100. This expansion signifies a leap forward in diagnostic capabilities, providing technicians with richer insights into engine performance and potential malfunctions.
Among these valuable parameters, EQ Ratio (Equivalence Ratio) stands out as a critical indicator of engine air/fuel mixture. Understanding and interpreting EQ Ratio data from your OBD2 scan tool is paramount for accurate diagnosis. This article will guide you through leveraging key OBD2 parameters, including EQ Ratio, to enhance your diagnostic process and efficiently pinpoint driveability issues.
Fuel Trim: Your Window into Fuel Delivery
Regardless of the specific driveability symptom, Short-Term Fuel Trim (STFT) and Long-Term Fuel Trim (LTFT) are indispensable starting points. Fuel trim acts as a real-time indicator of the Powertrain Control Module’s (PCM) adjustments to fuel delivery. It reveals how the engine’s computer is adapting to maintain the ideal air-fuel mixture. Expressed as a percentage, the optimal range for STFT and LTFT is within ±5%.
Positive fuel trim percentages signal that the PCM is enriching the fuel mixture to compensate for a perceived lean condition (too much air, not enough fuel). Conversely, negative percentages indicate the PCM is leaning out the mixture to correct a perceived rich condition (too much fuel, not enough air). STFT values typically fluctuate rapidly, reflecting immediate adjustments, while LTFT values are more stable, representing learned adaptations over time. If either STFT or LTFT exceeds ±10%, it warrants further investigation as it suggests a potential underlying issue.

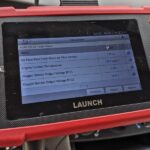
Image alt text: Screenshot of a generic OBD2 scan tool displaying live data parameters including RPM, coolant temperature, fuel trims (STFT and LTFT), and oxygen sensor readings, essential for diagnosing engine driveability issues.
To gain a comprehensive understanding, assess fuel trim across different engine operating ranges: idle, 1500 RPM, and 2500 RPM. For instance, if LTFT on Bank 1 (LTFT B1) shows +25% at idle but corrects to within ±5% at higher RPMs, suspect a vacuum leak affecting idle conditions. If the lean condition persists across all RPM ranges, the problem is more likely related to fuel supply issues such as a failing fuel pump or restricted fuel injectors.
Fuel trim can also help isolate problems to specific cylinder banks in bank-to-bank fuel control engines. For example, if LTFT B1 is -20% while LTFT B2 is +3%, the issue is likely confined to Bank 1 cylinders, guiding your diagnostic efforts.
Essential OBD2 Parameters for Driveability Diagnostics
Beyond fuel trim, several other OBD2 parameters provide crucial diagnostic information, even if fuel trim readings are within acceptable ranges. These parameters offer a broader view of engine operation and can reveal underlying problems:
- Fuel System Status 1 & 2: These should ideally indicate “Closed Loop (CL)”. If the system is in “Open Loop (OL)”, fuel trim data may be unreliable. “OL-Drive” suggests open loop during power enrichment or deceleration, while “OL-Fault” or “CL-Fault” indicate system faults affecting fuel control strategy.
- Engine Coolant Temperature (ECT): Verify the engine reaches operating temperature, typically 190°F (88°C) or higher. A consistently low ECT reading might cause the PCM to incorrectly enrich the fuel mixture, mimicking a cold engine condition.
- Intake Air Temperature (IAT): IAT should reflect ambient or underhood temperature, depending on sensor location. When the engine is cold (Key On Engine Off – KOEO), ECT and IAT readings should be within 5°F (3°C) of each other.
- Mass Airflow (MAF) Sensor: If equipped, the MAF sensor measures incoming air mass, critical for fuel calculations. Check MAF sensor readings across various RPM ranges, including Wide Open Throttle (WOT), against manufacturer specifications. Pay attention to the unit of measurement (grams per second (gm/S) or pounds per minute (lb/min)) to avoid misinterpretations.
- Manifold Absolute Pressure (MAP) Sensor: If present, the MAP sensor measures manifold pressure, indicating engine load. Readings are typically in inches of mercury (in./Hg). Remember that MAP sensor reading is not direct intake manifold vacuum but is related to barometric pressure.
- Oxygen Sensor Output Voltage (B1S1, B2S1, B1S2, etc.): Oxygen sensors monitor exhaust oxygen content, providing feedback for fuel mixture control and catalytic converter efficiency. Using a scan tool, confirm sensors switch rapidly between below 0.2 volts (lean) and above 0.8 volts (rich). A snap throttle test can often verify this switching. Graphing scan tools provide a visual representation of sensor performance over time.
It’s crucial to remember that OBD2 generic data is not real-time lab scope data. The PCM processes sensor data before transmitting it to the scan tool. Furthermore, OBD2 generic data has a limited data rate, typically around 10 samples per second for a single parameter, decreasing with multiple parameters selected. For detailed oxygen sensor analysis, consider testing with a lab scope if scan tool data appears slow or inconclusive.
Other valuable parameters include:
- Engine Speed (RPM) & Ignition Timing Advance: Useful for assessing idle control, ideally viewed with a graphing scan tool.
- Vehicle Speed Sensor (VSS) & Throttle Position Sensor (TPS): Verify accuracy and use as reference points for symptom duplication and data recording.
- Calculated Load: Indicates engine load percentage.
- MIL Status: Check for Malfunction Indicator Lamp (Check Engine Light) status.
- Fuel Pressure: Direct fuel pressure readings if available.
- Auxiliary Input Status (PTO): Power Take-Off status, if applicable.
Unlocking Advanced Diagnostics with Enhanced OBD2 Parameters
Modern OBD2 systems, particularly CAN-equipped vehicles from 2004 onwards, offer a wealth of expanded parameters, significantly enhancing diagnostic depth. These newer parameters provide more granular insights into engine and emissions systems. Let’s examine some key additions, including a deeper dive into EQ Ratio:
-
FUEL STAT 1 (Fuel System Status): Provides more detailed fuel system status information beyond simple “Open Loop” or “Closed Loop,” including reasons for open-loop operation, such as “OL-Drive” (power enrichment) or “OL-Fault” (system malfunction).
-
ENG RUN TIME (Time Since Engine Start): Helps correlate fault occurrences with engine run time, useful for intermittent issues.
-
DIST MIL ON (Distance Traveled While MIL Is Activated): Indicates how long a problem has persisted, potentially influencing repair decisions and customer communication.
-
COMMAND EGR (EGR_PCT): Displays commanded Exhaust Gas Recirculation (EGR) valve position as a percentage. It reflects PCM command, not actual flow, but helps assess EGR system control.
-
EGR ERROR (EGR_ERR): Shows EGR position error as a percentage, calculated as (Actual EGR Position – Commanded EGR) / Commanded EGR. High error percentages can indicate EGR valve sticking or sensor malfunctions.
-
EVAP PURGE (EVAP_PCT): Displays commanded Evaporative Emission (EVAP) purge valve position as a percentage. Crucial for diagnosing fuel trim anomalies, as normal purge operation can influence fuel trim. Temporarily blocking the purge valve can isolate EVAP purge system influence on fuel trim issues.
-
FUEL LEVEL (FUEL_PCT): Indicates fuel tank level as a percentage. Essential for meeting preconditions for certain diagnostic monitors, such as misfire or evaporative emission monitors, which often require specific fuel level ranges.
-
WARM-UPS (WARM_UPS): Counts warm-up cycles since DTCs were cleared. A warm-up is defined as a significant coolant temperature rise followed by reaching a minimum temperature. Useful for duplicating conditions for codes requiring multiple warm-up cycles.
-
BARO (BARO): Barometric pressure reading, crucial for verifying MAP and MAF sensor accuracy, especially at different altitudes. Check KOEO for baseline accuracy.
-
CAT TMP B1S1/B2S1 (CATEMP11, 21, etc.): Catalyst temperature readings, either direct sensor readings or inferred values. Valuable for assessing catalyst performance and diagnosing potential overheating or premature failure.
-
CTRL MOD (V) (VPWR): PCM voltage supply reading. Often overlooked, but critical. Low voltage can cause various driveability problems. Verify it’s close to battery voltage. Note: this parameter may not capture all PCM voltage supplies, such as ignition voltage, which might require enhanced scan tools or direct measurement.
-
ABSOLUT LOAD (LOAD_ABS): Absolute engine load, normalized air mass per intake stroke, displayed as a percentage. Ranges from 0-95% for naturally aspirated and 0-400% for boosted engines. Used for spark and EGR scheduling and assessing engine pumping efficiency.
-
OL EQ RATIO (EQ_RAT): Commanded Equivalence Ratio. This parameter is pivotal for understanding the PCM’s target air/fuel mixture. EQ Ratio represents the commanded air/fuel ratio relative to stoichiometry (the ideal air/fuel mixture). An EQ Ratio of 1.0 indicates stoichiometric mixture. Values below 1.0 (e.g., 0.95) indicate a commanded richer mixture, while values above 1.0 (e.g., 1.05) indicate a commanded leaner mixture.
For conventional oxygen sensor systems, EQ Ratio will typically display 1.0 in closed loop. For wide-range or linear oxygen sensor systems, EQ Ratio reflects the PCM’s commanded ratio in both open and closed loop.
To calculate the actual Air/Fuel (A/F) ratio, multiply the stoichiometric A/F ratio (approximately 14.64:1 for gasoline) by the EQ Ratio. For example, with an EQ Ratio of 0.95, the commanded A/F ratio is roughly 14.64 * 0.95 = 13.9:1 (richer than stoichiometric). Understanding EQ Ratio in conjunction with oxygen sensor readings and fuel trim provides a comprehensive view of fuel control accuracy.
-
TP-B ABS, APP-D, APP-E, COMMAND TAC: These parameters relate to throttle-by-wire systems and are crucial for diagnosing electronic throttle control issues. The specific parameters vary depending on the throttle-by-wire system type.
Interpreting Scan Tool Data Symbols
Advanced scan tools may use symbols to provide additional context to parameter readings, especially on vehicles with multiple ECUs or CAN bus systems:
Image alt text: Close-up view of a scan tool screen highlighting data parameter symbols: a red circle around a “greater than” symbol (>), and a blue circle around an “equals” symbol (=), indicating ECU response variations and parameter support across multiple ECUs respectively.
-
Greater Than Symbol (>): Indicates that multiple ECU responses for a parameter differ in value, suggesting potential communication or data inconsistency issues on the CAN bus.
-
Equals Sign (=): Indicates that multiple ECUs support the parameter and are reporting similar values, confirming parameter availability across modules.
-
Exclamation Point (!): Indicates that no response was received for a parameter that should be supported, signaling a potential communication problem or parameter availability issue.
These symbols provide valuable clues when diagnosing complex communication network problems.
Conclusion: Mastering OBD2 Generic Data for Efficient Diagnostics
OBD2 generic scan data has evolved significantly, offering a powerful and accessible diagnostic tool for automotive technicians. By understanding and effectively utilizing key parameters like fuel trim, oxygen sensor readings, and the newly expanded parameters including EQ Ratio, technicians can significantly enhance their diagnostic capabilities and efficiently resolve driveability issues.
Investing in an OBD2 generic scan tool with graphing and recording capabilities is highly recommended, as it provides valuable insights into dynamic parameter behavior. While OBD2 generic specifications offer a standardized framework, always consult vehicle-specific service information for variations and detailed specifications. Mastering the interpretation of OBD2 generic data, particularly parameters like EQ Ratio, empowers technicians to diagnose modern vehicles with greater precision and speed, ultimately leading to improved repair outcomes and customer satisfaction.
Download PDF