The On-Board Diagnostics II (OBD2) system is an indispensable feature in today’s vehicles, acting as a health monitor providing crucial real-time data and diagnostic insights. For both car enthusiasts and professional technicians, understanding how to interpret OBD2 live data, especially recognizing Normal Obd2 Live Data Readings, is key to assessing a vehicle’s condition and performance. This article offers a comprehensive guide to navigating the complexities of OBD2 data and understanding what constitutes normal parameters.
A Quick Look at OBD2 History
The journey to OBD2 was evolutionary. Starting with OBD1, an early system with limited diagnostic capabilities, the automotive industry progressed to OBD2. This advancement brought standardized diagnostic trouble codes (DTCs) and the capability to monitor live data streams. This shift was largely influenced by growing environmental concerns and stricter regulations, making vehicle diagnostics more standardized, accessible, and thorough. OBD2’s standardization means regardless of vehicle brand, the fundamental diagnostic approach remains consistent.
Understanding OBD2 Live Data Basics
OBD2 live data provides a dynamic view of your vehicle’s operational status, offering a real-time stream of information from the engine control unit (ECU) and other integrated systems. It’s like a continuous health check, displaying actual values and status updates directly from the vehicle’s sensors and modules. This real-time monitoring is invaluable for assessing vehicle performance under various conditions and diagnosing issues as they occur. Understanding normal OBD2 live data readings sets the baseline for identifying deviations that may indicate problems.
Key Parameters in Normal OBD2 Live Data Readings
When accessing OBD2 live data, you’ll encounter a range of parameters. Understanding what normal OBD2 live data readings are for these parameters is crucial for effective diagnostics. Here are some of the most common and important ones:
-
Engine RPM (Revolutions Per Minute): This indicates how fast the engine’s crankshaft is rotating. Normal idle RPM typically ranges from 600-1000 RPM, varying slightly depending on the vehicle and engine type. Readings significantly outside this range at idle could suggest issues.
-
Vehicle Speed: This parameter shows the vehicle’s current speed, as measured by the speed sensors. Normal readings should accurately reflect the actual speed of the vehicle. Discrepancies could indicate sensor problems or issues with the vehicle’s speed control systems.
-
Throttle Position: Expressed as a percentage, this parameter reflects the opening angle of the throttle valve. At idle, the throttle position is usually at its minimum (e.g., 0% or a very low percentage). When accelerating, normal OBD2 live data readings will show an increasing percentage as the throttle opens wider.
-
Fuel System Status: This provides information about the operational mode of the fuel system, such as open loop or closed loop. In a normally operating vehicle at running temperature, the system should be in closed loop, indicating that the ECU is using feedback from the oxygen sensors to adjust fuel delivery.
-
Short Term and Long Term Fuel Trim (STFT & LTFT): These values indicate the adjustments the ECU is making to the fuel mixture. Normal OBD2 live data readings for fuel trims should ideally be close to 0%. Deviations beyond ±10% to ±20% may suggest fuel delivery or air intake issues. Negative values indicate the system is reducing fuel (running rich), while positive values indicate it’s adding fuel (running lean).
-
Oxygen Sensor Data: Oxygen sensors measure the oxygen content in the exhaust gas, crucial for air-fuel mixture optimization. Normal OBD2 live data readings typically show the sensors oscillating rapidly in closed loop operation, indicating they are actively monitoring and adjusting the mixture. Readings that are flat or slow to respond can indicate sensor issues.
-
Coolant Temperature: This parameter reflects the engine coolant temperature. Normal OBD2 live data readings for coolant temperature usually fall within the range of 195-220°F (90-105°C) once the engine is warmed up, although this can vary by vehicle. Overheating or consistently low readings are indicative of cooling system problems.
-
Intake Air Temperature (IAT): This measures the temperature of the air entering the intake manifold. Normal OBD2 live data readings for IAT should be close to the ambient air temperature, though it can be slightly higher due to engine heat. Abnormally high readings can affect engine performance.
-
Manifold Absolute Pressure (MAP): MAP sensor measures the pressure in the intake manifold. At idle, normal OBD2 live data readings for MAP are typically lower (high vacuum), increasing as the throttle opens and engine load increases. Unusual MAP readings can point to vacuum leaks or sensor malfunctions.
Benefits of Monitoring Normal OBD2 Live Data Readings
Understanding and regularly monitoring normal OBD2 live data readings offers several key advantages:
-
Real-Time Performance Monitoring: Live data allows you to see immediately how any changes or repairs impact your vehicle’s performance. This instant feedback is invaluable for assessing the effectiveness of maintenance and modifications.
-
Preventative Maintenance: By tracking normal OBD2 live data readings over time, you can identify subtle deviations from the norm. These early warnings can help pinpoint potential issues before they escalate into major failures, saving time and money on extensive repairs.
-
Performance Optimization: For car enthusiasts and professionals, live data is essential for fine-tuning vehicle performance and maximizing fuel efficiency. By observing parameters like fuel trims, throttle position, and RPM under different driving conditions, adjustments can be made to optimize engine performance.
-
Emissions Compliance: Live data can be used to verify that your vehicle is operating within acceptable emissions standards. Monitoring oxygen sensor data and fuel trims helps ensure your vehicle is running cleanly and efficiently, contributing to environmental responsibility.
Accessing and Interpreting Normal OBD2 Live Data Readings
To start monitoring normal OBD2 live data readings, you will need the right tools. Here are common options for accessing this data:
-
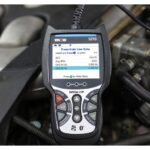
Handheld OBD2 Scanners: These are portable, user-friendly devices that plug directly into your vehicle’s OBD2 port and display live data on their screen. They are a convenient option for quick checks and basic diagnostics.
-
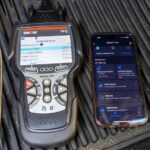
Smartphone Apps with OBD2 Bluetooth Adapters: These adapters wirelessly connect your vehicle’s OBD2 port to your smartphone. Paired with a compatible app, they offer a more interactive and often more feature-rich interface for viewing and analyzing live data.
-
Professional Diagnostic Tools: Used by automotive technicians, these advanced tools provide the most comprehensive features, including detailed live data, graphing capabilities, and bi-directional controls for in-depth diagnostics and system testing.
Interpreting normal OBD2 live data readings effectively requires some familiarity with vehicle systems and how they interact. However, even for vehicle owners without extensive automotive knowledge, understanding basic parameters and recognizing deviations from normal OBD2 live data readings can be incredibly useful for maintaining vehicle health.
Essential Tools for Monitoring Normal OBD2 Live Data Readings
To effectively monitor normal OBD2 live data readings, you’ll need a reliable OBD2 scanner or reader. Tools like the GaragePro OBD scan tool are specifically designed to provide access to live data and make vehicle diagnostics more accessible. Choosing the right tool depends on your needs, from basic handheld scanners for occasional checks to more advanced professional-grade tools for detailed analysis.
Setting Up Your OBD2 Reader for Live Data Monitoring
Setting up an OBD2 reader to monitor normal OBD2 live data readings is generally a simple process. The primary step is locating the OBD2 port in your vehicle, typically found under the dashboard on the driver’s side. Once located, plug your OBD2 reader into this port. If you encounter connection problems, ensure that your reader is compatible with your vehicle’s make and model and check for any debris or damage in the OBD2 port. For Bluetooth adapters, you’ll also need to pair the device with your smartphone or tablet via the app interface.
Navigating the OBD2 Interface to Access Live Data
Navigating the OBD2 interface to find normal OBD2 live data readings is usually straightforward, though the exact steps can vary slightly depending on the scanner or app you are using.
Basic Navigation for Live Data
- Powering Up: Most OBD2 scanners will automatically power on once they are correctly plugged into the OBD2 port.
- Main Menu: Upon starting, the device will typically display a main menu. Look for options like ‘Live Data,’ ‘Readings,’ or similar terms.
- Selecting Live Data: Choose the ‘Live Data’ or equivalent option from the main menu. This will usually take you to a screen where you can select specific parameters to monitor.
- Parameter Selection: You will likely see a list of available parameters. Select the parameters you want to monitor, such as Engine RPM, Coolant Temperature, Vehicle Speed, etc. Choose parameters relevant to what you are diagnosing or monitoring.
- Viewing Live Data: Once parameters are selected, the scanner will display real-time data streams for those parameters. This is where you will observe the current OBD2 live data readings and compare them to what you understand to be normal.
Advanced Features for Data Analysis
- Graphing and Logging: Many advanced scanners and apps offer graphing capabilities, allowing you to visualize normal OBD2 live data readings over time. This is particularly useful for spotting trends, intermittent issues, or performance changes during driving. Data logging allows you to record data for later analysis.
- Customizable Dashboards: Some advanced apps let you create custom dashboards, displaying only the normal OBD2 live data readings that are most important to you in a format that is easy to read at a glance.
- Freeze Frame Data: While focusing on live data, remember that the ‘Freeze Frame’ function captures data at the moment a DTC is set. This snapshot can be helpful in understanding the conditions under which a problem occurred, complementing your live data analysis.
Tips for Effective OBD2 Interface Navigation
- Consult the User Manual: Each OBD2 scanner or app has its own interface and features. Always refer to the user manual to understand specific functions and navigation steps.
- Start with Basic Parameters: When first exploring live data, focus on the most common and critical parameters. Understanding normal OBD2 live data readings for RPM, temperature, and speed is a good starting point.
- Record Data for Comparison: If you are diagnosing a specific issue or monitoring vehicle performance, note down the OBD2 live data readings under various conditions (idle, acceleration, cruising). This creates a baseline for comparison and helps identify deviations from normal.
- Prioritize Safety: When using live data while driving, ensure safety. Have a passenger monitor the data, or use features that allow for voice readouts if available. Never compromise driving safety to look at live data readings.
- Stay Updated: OBD2 systems and scanner functionalities evolve. Keep your scanner software updated and stay informed about new features and functionalities to maximize the tool’s effectiveness.
Interpreting Normal OBD2 Live Data Readouts for Diagnostics
Interpreting normal OBD2 live data readings is essential for accurate vehicle diagnostics. It’s about recognizing not just the values, but what those values mean in the context of your vehicle’s operation.
Key Live Data Parameters and Their Normal Ranges
- Engine RPM: Normal OBD2 live data readings at idle: 600-1000 RPM (vehicle dependent). During normal driving, RPM varies widely based on speed and load.
- Vehicle Speed: Normal OBD2 live data readings should match the speedometer and driving conditions.
- Throttle Position: Normal OBD2 live data readings at idle: close to 0%. Increasing with acceleration.
- Oxygen Sensor Data: Normal OBD2 live data readings in closed loop: rapid oscillation.
- Coolant Temperature: Normal OBD2 live data readings when warm: 195-220°F (90-105°C), but check vehicle-specific norms.
- Fuel Trims (STFT/LTFT): Normal OBD2 live data readings: ideally close to 0%, acceptable range typically ±10%.
- Intake Air Temperature: Normal OBD2 live data readings: close to ambient temperature, slightly higher is acceptable.
- Manifold Absolute Pressure (MAP): Normal OBD2 live data readings at idle: lower (high vacuum), increasing with load.
Tips for Effective Interpretation
- Establish a Baseline of Normal: The key to interpreting live data is knowing what normal OBD2 live data readings are for your specific vehicle. Refer to your vehicle’s service manual or reliable online resources for typical ranges.
- Compare Readings to Expected Values: Once you know the normal ranges, compare your live data readings. Deviations from normal OBD2 live data readings are your primary indicators of potential issues.
- Correlate Data with Symptoms: Don’t look at data in isolation. Relate unusual readings to the symptoms your vehicle is exhibiting. For example, high coolant temperature readings coupled with engine overheating symptoms strongly suggest a cooling system problem.
- Use Graphing for Trend Analysis: Graphing live data over time can reveal patterns and anomalies that are not obvious in static readings. This is especially helpful for diagnosing intermittent problems.
- Cross-Reference with DTCs: Diagnostic Trouble Codes (DTCs) provide a starting point. Use live data to investigate further into the systems indicated by DTCs. Live data can give you the real-time context and specifics that DTCs alone don’t provide.
Practical Applications of Live Data Interpretation
- Diagnosing Fuel Efficiency Issues: Monitor oxygen sensor data, fuel trims, and MAP readings to identify problems in the fuel or air intake systems that could be causing poor fuel economy. Normal OBD2 live data readings in these areas are critical for optimal fuel efficiency.
- Evaluating Engine Performance Problems: For engine performance issues like rough idling or misfires, focus on parameters like RPM, throttle position, and fuel trims. Deviations from normal OBD2 live data readings can pinpoint the source of the problem.
- Assessing Emissions Issues: Pay close attention to oxygen sensor readings and catalytic converter efficiency data when diagnosing emissions problems. Normal OBD2 live data readings for emission-related parameters are essential for passing emissions tests.
Effective interpretation of normal OBD2 live data readings comes with practice and a good understanding of vehicle systems. Start with understanding the normal ranges for key parameters in your vehicle, and gradually expand your knowledge to more advanced data points.
Understanding Common OBD2 Live Data Parameters in Detail
To effectively utilize OBD2 live data, a deeper understanding of common parameters beyond just normal OBD2 live data readings is necessary. Here’s a more detailed look at some key parameters:
1. Engine RPM (Revolutions Per Minute) – Detailed View
- In-Depth Look: RPM is a fundamental measure of engine speed. Beyond just idle speed, monitoring RPM under different conditions (acceleration, cruising, deceleration) is important.
- Diagnostic Insights: Erratic RPM readings can indicate misfires, vacuum leaks, or issues with the idle air control system. Consistently high RPM at idle might suggest a problem with the throttle or idle control. Low RPM issues can relate to engine load or insufficient air intake.
2. Vehicle Speed – Detailed View
- In-Depth Look: Vehicle speed data is not just for speedometer verification. It’s also used by the ECU for various calculations, including transmission control and traction control.
- Diagnostic Insights: Inaccurate vehicle speed readings can cause issues with transmission shifting, cruise control, and ABS/traction control systems. Discrepancies between actual and reported speed can point to sensor failures or wiring problems.
3. Throttle Position – Detailed View
- In-Depth Look: Throttle position directly relates to driver input and engine load. It’s crucial for understanding acceleration and engine response.
- Diagnostic Insights: A throttle position sensor (TPS) that is not reading correctly can cause hesitation, poor acceleration, and idle problems. Sticking or erratic throttle position readings can indicate a faulty TPS or mechanical issues with the throttle body.
4. Oxygen Sensor Data – Detailed View
- In-Depth Look: Oxygen sensors (O2 sensors) are critical for monitoring the air-fuel ratio and ensuring efficient combustion and emissions control. Modern vehicles often have multiple O2 sensors (pre- and post-catalytic converter).
- Diagnostic Insights: Slow response, flatlining, or incorrect voltage readings from O2 sensors can indicate sensor failure, exhaust leaks, or catalytic converter problems. Comparing pre- and post-cat sensor readings helps assess catalytic converter efficiency.
5. Fuel System Status – Detailed View
- In-Depth Look: This parameter indicates the operational state of the fuel system (e.g., open loop, closed loop, fault conditions).
- Diagnostic Insights: The fuel system should be in closed loop once the engine is warmed up and running normally. If it remains in open loop, it could indicate issues preventing the system from using sensor feedback for fuel control, potentially leading to poor fuel economy and emissions.
6. Intake Air Temperature (IAT) – Detailed View
- In-Depth Look: IAT affects air density and thus engine performance. The ECU uses IAT data to adjust fuel and ignition timing.
- Diagnostic Insights: Extremely high IAT readings can indicate a problem with air intake restriction or sensor malfunction, leading to reduced engine power. Consistently low readings might also suggest a sensor issue.
7. Coolant Temperature – Detailed View
- In-Depth Look: Coolant temperature is vital for engine health and performance. Overheating can cause severe engine damage, while consistently low temperatures can affect efficiency and emissions.
- Diagnostic Insights: Overheating readings point to cooling system issues (e.g., thermostat, radiator, water pump). Failure to reach normal operating temperature can indicate a faulty thermostat.
8. Manifold Absolute Pressure (MAP) – Detailed View
- In-Depth Look: MAP sensor measures intake manifold pressure, reflecting engine load and vacuum.
- Diagnostic Insights: High MAP readings at idle suggest low vacuum, possibly due to vacuum leaks, timing issues, or engine mechanical problems. Low MAP readings under load may indicate sensor failure or intake restrictions.
9. Fuel Trims (Short and Long Term) – Detailed View
- In-Depth Look: Fuel trims are percentage adjustments the ECU makes to the base fuel delivery calculation to maintain the ideal air-fuel ratio. Short-term fuel trim (STFT) is immediate adjustments, while long-term fuel trim (LTFT) reflects learned adjustments over time.
- Diagnostic Insights: Consistently high positive fuel trims (lean condition) could indicate vacuum leaks, low fuel pressure, or dirty fuel injectors. Consistently high negative fuel trims (rich condition) might suggest issues like fuel pressure regulator problems, leaking injectors, or MAF sensor inaccuracies.
10. Battery Voltage – Detailed View
- In-Depth Look: While seemingly simple, battery voltage is crucial for the entire vehicle electrical system.
- Diagnostic Insights: Low battery voltage readings (below 12V with engine off, below 13.5-14.5V when running) can indicate battery problems, charging system faults (alternator), or parasitic drains.
Understanding these parameters in detail, beyond just recognizing normal OBD2 live data readings, empowers more accurate and effective vehicle diagnostics.
Exploring Advanced Features in OBD2 Live Data Reading
Advanced OBD2 live data reading goes beyond basic parameter monitoring, providing deeper diagnostic capabilities. These features are particularly beneficial for complex issues and performance tuning.
1. Real-Time Graphing – Advanced Feature
- Enhanced Utility: Graphing allows you to visualize normal OBD2 live data readings and deviations over time, making it easier to spot trends, fluctuations, and intermittent problems that static data might miss.
- Diagnostic Application: Useful for diagnosing issues like misfires (RPM drops), sensor response delays (O2 sensor graphs), and fuel trim variations under changing loads.
2. Mode 6 Testing – Advanced Feature
- In-Depth Diagnostics: Mode 6 provides access to on-board diagnostic monitoring test results for emission-related systems. It can show detailed test results that may not trigger standard DTCs.
- Diagnostic Application: Helps identify potential issues in components like catalytic converters, oxygen sensors, and evaporative emission systems before they cause a check engine light, aiding in proactive maintenance.
3. Fuel System Monitoring – Advanced Feature
- Detailed Fuel Analysis: Advanced tools can provide more granular data on fuel pressure, injector pulse width, and fuel pump duty cycle, going beyond basic fuel system status.
- Diagnostic Application: Essential for diagnosing complex fuel delivery issues, optimizing fuel efficiency, and identifying problems in high-performance fuel systems.
4. Advanced Emission Readings – Advanced Feature
- Comprehensive Emission Data: Access to data like catalytic converter efficiency, EGR flow, and evaporative system pressures provides a more complete picture of vehicle emissions performance.
- Diagnostic Application: Crucial for diagnosing complex emission system faults and ensuring compliance with emission standards.
5. Bi-Directional Control – Advanced Feature
- Active Testing: Some advanced scanners offer bi-directional control, allowing you to send commands to the vehicle to activate components for testing purposes (e.g., turning on/off fuel pump, cycling A/C compressor).
- Diagnostic Application: Enables active diagnosis of components and systems, verifying functionality and pinpointing faults more efficiently.
6. Customizable Data Points and Dashboards – Advanced Feature
- Tailored Monitoring: Advanced systems allow you to select and customize which data parameters are displayed and how they are presented, creating a focused view of normal OBD2 live data readings most relevant to your diagnostic task.
- Enhanced User Experience: Customizable dashboards improve efficiency by displaying only the necessary data in an easy-to-read format, reducing information overload.
7. Transmission Data – Advanced Feature
- Transmission Health Insights: Access to transmission-specific data (e.g., transmission temperature, gear position, torque converter lock-up status) is crucial for diagnosing automatic transmission issues.
- Diagnostic Application: Helps in diagnosing shifting problems, transmission overheating, and torque converter issues, contributing to preventative transmission maintenance.
8. ABS and Airbag System Diagnostics – Advanced Feature
- Safety System Monitoring: Some advanced OBD2 tools can access data from ABS (Anti-lock Braking System) and airbag systems, providing insights into these critical safety features.
- Diagnostic Application: Essential for diagnosing warning lights related to ABS and airbag systems, ensuring safety system functionality.
9. PID (Parameter ID) Data – Advanced Feature
- Deep Dive into Data: PID data allows access to a vast range of specific data points defined by SAE standards and manufacturer-specific extensions, offering very detailed insights into vehicle operation.
- Diagnostic Application: Useful for advanced diagnostics and research, allowing technicians to delve deep into engine and vehicle system behavior.
Leveraging these advanced features, along with understanding normal OBD2 live data readings, empowers professionals and serious DIYers to perform comprehensive diagnostics and optimize vehicle performance to a higher degree.
Troubleshooting Issues with OBD2 Live Data
Encountering issues while accessing or interpreting OBD2 live data can be frustrating. Here are troubleshooting tips to address common problems:
-
Verify OBD2 Scanner Connection: Ensure the scanner cable is securely plugged into the OBD2 port. A loose connection is a common cause of data reading issues.
-
Check Vehicle Compatibility: Confirm that your OBD2 scanner is compatible with your vehicle’s make, model, and year. Not all scanners support all vehicle protocols or parameters.
-
Test Scanner on Another Vehicle: To rule out a faulty scanner, try using it on a different vehicle. If it works on another vehicle, the issue may be with the original vehicle’s OBD2 system or ECU.
-
Check Vehicle Battery Voltage: Low vehicle battery voltage can sometimes interfere with ECU communication and data transmission. Ensure the vehicle battery is adequately charged.
-
Inspect for ECU Communication Problems: Check vehicle fuses related to the ECU and diagnostic port. Blown fuses or wiring issues can prevent communication.
-
Sensor Accuracy and Calibration: If you suspect inaccurate data, consider the possibility of faulty sensors. Compare readings to expected normal OBD2 live data readings and consider sensor testing or replacement if readings are consistently out of range.
-
Software and Firmware Updates: Ensure your OBD2 scanner has the latest software and firmware updates. Updates often include bug fixes, expanded vehicle compatibility, and improved data accuracy.
-
Understand Normal Data Ranges: Misinterpretation can occur if you’re not familiar with normal OBD2 live data readings for your specific vehicle. Refer to vehicle-specific service information for guidance.
-
Filter and Focus on Relevant Data: When faced with a large volume of live data, filter and focus on the parameters most relevant to the problem you are diagnosing. This helps avoid information overload and streamlines troubleshooting.
-
Seek Professional Diagnostic Help: For complex or persistent issues, or if you’re unsure about interpreting data, consult a professional mechanic. They have advanced tools and expertise to diagnose intricate problems using OBD2 data and other diagnostic methods.
Effective troubleshooting of OBD2 live data issues combines systematic checks with a solid understanding of vehicle systems and expected normal OBD2 live data readings.
OBD2 Live Data’s Role in Preventive Vehicle Maintenance
OBD2 live data is not just for diagnosing problems; it’s a powerful tool for preventive vehicle maintenance. Regular monitoring of normal OBD2 live data readings can significantly contribute to vehicle longevity and reliability.
-
Early Detection of Minor Issues: By periodically checking live data, you can spot subtle deviations from normal OBD2 live data readings that might indicate early stages of problems. For example, slightly off fuel trims or gradually increasing coolant temperatures can be detected before they trigger warning lights or cause breakdowns.
-
Optimizing Vehicle Performance and Efficiency: Monitoring parameters like fuel trims, oxygen sensor data, and intake air temperature can help ensure your vehicle is running at peak efficiency. Addressing minor issues identified through live data can maintain optimal fuel economy and engine performance.
-
Reducing Long-Term Repair Costs: Preventive maintenance based on OBD2 live data insights can prevent minor issues from becoming major, costly repairs. Early intervention is always more economical than dealing with severe component failures.
-
Enhancing Vehicle Safety: Regularly checking systems like ABS and transmission through live data can help ensure these critical safety and performance systems are functioning correctly, contributing to overall vehicle safety and reliability.
-
Supporting Emission Compliance: Monitoring emission-related parameters helps ensure your vehicle remains environmentally compliant. Addressing issues affecting emissions, identified through live data, can prevent failing emissions tests and contribute to cleaner air.
-
Informed Maintenance Scheduling: Tracking normal OBD2 live data readings over time can provide insights into the wear and tear of components, allowing for a more informed and proactive maintenance schedule, rather than strictly following mileage-based intervals.
-
Simplifying Routine Checks: OBD2 live data makes routine vehicle health checks quicker and more data-driven. Instead of relying solely on visual inspections, live data provides quantifiable metrics of vehicle condition.
In essence, incorporating OBD2 live data monitoring into your vehicle maintenance routine is a proactive approach to vehicle care, promoting vehicle health, safety, and longevity.
Enhancing Vehicle Performance Through OBD2 Live Data Analysis
Beyond diagnostics and maintenance, OBD2 live data is also invaluable for enhancing vehicle performance. Analyzing normal OBD2 live data readings and optimizing based on this data can lead to improved power, responsiveness, and efficiency.
-
Fuel Efficiency Optimization: By closely examining fuel trim data and oxygen sensor readings, adjustments can be made to optimize the air-fuel mixture for maximum fuel economy without compromising performance.
-
Engine Response Tuning: Monitoring throttle position, RPM, and MAP data during acceleration can help identify areas for improving engine responsiveness. Adjustments to timing, fuel delivery, or air intake can be made and their effects immediately assessed via live data.
-
Performance Issue Rectification: Live data can pinpoint performance bottlenecks. For example, monitoring boost pressure in turbocharged engines can diagnose under-boost or over-boost conditions, allowing for targeted fixes.
-
Custom Engine Tuning: For enthusiasts, OBD2 live data is crucial for custom engine tuning. Real-time feedback from sensors allows tuners to precisely adjust parameters like fuel maps and ignition timing for enhanced power output, while ensuring engine safety by monitoring parameters like knock and exhaust gas temperature.
-
Transmission Efficiency Improvement: In vehicles where transmission data is accessible, monitoring parameters like transmission temperature and gear shift points can help optimize transmission performance for smoother shifts and better acceleration.
-
Emissions Reduction While Maintaining Performance: Adjustments based on live data can help reduce harmful emissions while maintaining or even enhancing engine performance. Fine-tuning combustion for optimal efficiency naturally leads to cleaner emissions.
-
Predictive Performance Maintenance: By tracking performance-related parameters, you can anticipate potential issues that could degrade performance over time, allowing for preemptive maintenance to keep the vehicle performing at its best.
In summary, OBD2 live data provides a data-driven approach to vehicle performance enhancement, enabling precise adjustments and continuous monitoring to achieve and maintain peak vehicle performance.
Conclusion: Embracing OBD2 Live Data for Optimal Vehicle Health
Understanding how to read and interpret normal OBD2 live data readings is an increasingly essential skill for vehicle owners and technicians alike. It empowers you with real-time insights into your vehicle’s operation, enabling proactive maintenance, accurate diagnostics, and performance optimization. By embracing OBD2 live data, you are not only investing in the longevity and efficiency of your vehicle but also taking a step towards becoming a more informed and engaged vehicle owner. As vehicle technology advances, the ability to leverage OBD2 data will only become more valuable in ensuring your vehicle remains in peak condition and continues to provide reliable service.